Kubernetes Autoscaling: HPA vs KEDA — A Platform Engineer's Guide
Kubernetes Autoscaling: HPA vs KEDA — A Platform Engineer's Guide
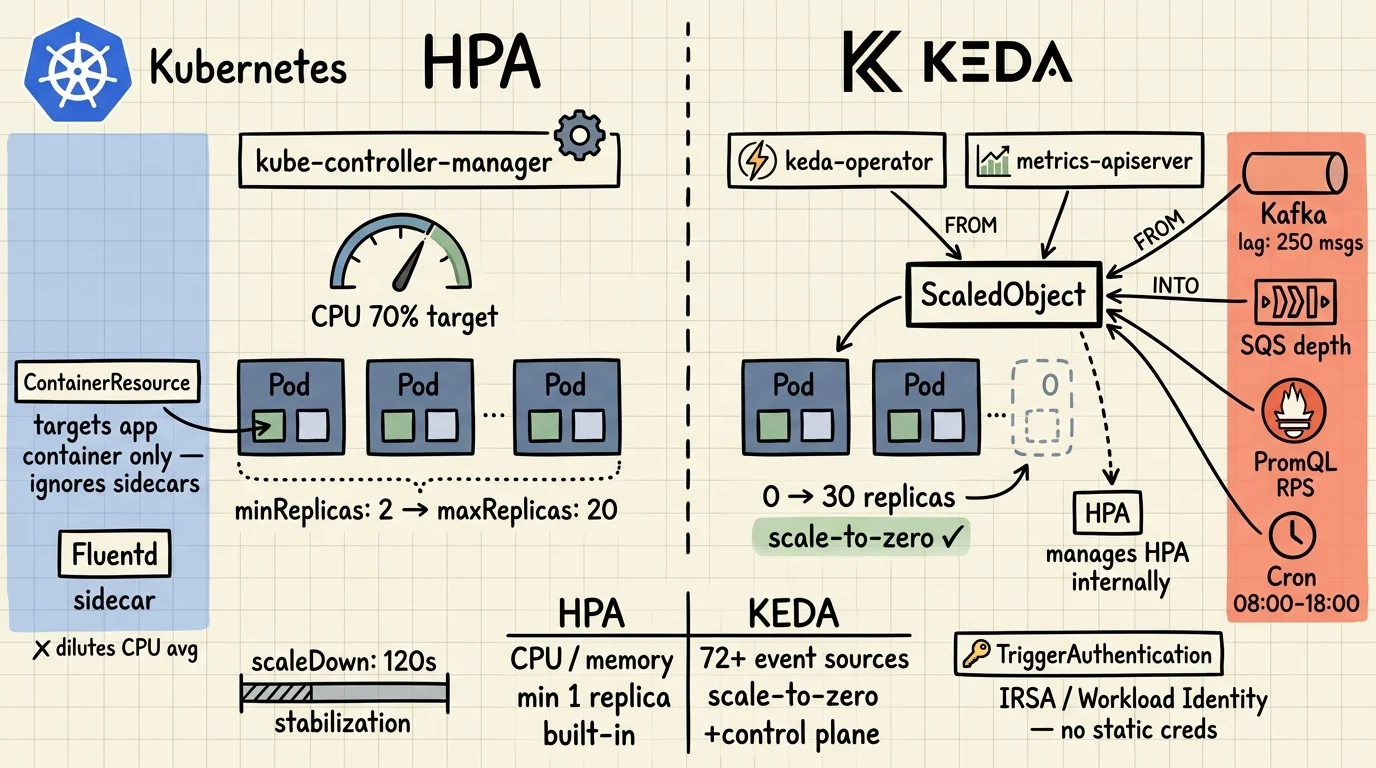
HPA is the right default. It handles CPU-bound HTTP services well, it's built into Kubernetes, and it needs no extra moving parts. The problems start when you push it past those assumptions: sidecars flattening your CPU averages, queue consumers that should idle at zero, or workloads whose load has nothing to do with CPU at all.
That's where KEDA comes in. But it's not a replacement. KEDA wraps HPA. When you deploy a ScaledObject, KEDA creates and manages an HPA under the hood. Choosing KEDA means getting both. What you're really deciding is whether your workload needs event-driven triggers and scale-to-zero on top of what HPA already provides.
This post covers how each tool works, what changed in recent Kubernetes releases, and which patterns to reach for in production. All YAML here is deployable. No placeholder configs.
Key Takeaways
- HPA polls every 15 seconds and scales on CPU, memory, or custom metrics — but can't scale to zero, and sidecars corrupt pod-level averages (K8s docs, 2026).
- ContainerResource metrics (stable in K8s 1.30) let HPA target a specific container, fixing the sidecar problem without KEDA.
- KEDA acts as both a scale-to-zero agent and a metrics adapter for HPA — it doesn't replace HPA, it extends it with 72+ event source scalers (KEDA docs, 2026).
- Use HPA for predictable HTTP workloads. Use KEDA for queue consumers, scheduled jobs, and anything that should hit zero replicas.
How Does HPA Actually Work?
HPA is a control loop in kube-controller-manager that runs every 15 seconds. The formula is simple: desiredReplicas = ceil(currentReplicas × currentMetric / targetMetric). It reads from three metric APIs: metrics.k8s.io (CPU/memory via metrics-server), custom.metrics.k8s.io, and external.metrics.k8s.io (Kubernetes HPA docs, 2026).
The autoscaling/v2 API — which has been stable since Kubernetes 1.23 — gives you all three metric types in one resource. This is the version you should be using. autoscaling/v1 only supports CPU.
apiVersion: autoscaling/v2
kind: HorizontalPodAutoscaler
metadata:
  name: web-api-hpa
spec:
  scaleTargetRef:
    apiVersion: apps/v1
    kind: Deployment
    name: web-api
  minReplicas: 2
  maxReplicas: 20
  metrics:
  - type: Resource
    resource:
      name: cpu
      target:
        type: Utilization
        averageUtilization: 70
For standard web services, this works. CPU rises with load, HPA adds replicas, CPU drops. Clean feedback loop.
For background on how resource requests affect scheduling and bin-packing, see Architecturing to Scale: Cloud Architecture in 2026.
Where HPA Breaks Down
Three scenarios break the CPU-as-load-proxy assumption.
Sidecars dilute the average. If your pod runs a Fluentd log shipper alongside the main app container, HPA measures the blended CPU of both. Fluentd stays near-idle regardless of traffic. The combined average stays low even when the app container is saturated. HPA sees no reason to scale. Your app starves.
Queue consumers react too late. A worker that pulls from Kafka or SQS only consumes CPU after it starts processing. By the time CPU climbs and HPA reacts, you've already got a queue backlog. You're scaling to address load that already happened.
Scale-to-zero is impossible. HPA requires at least one running replica to collect metrics. You can't scale down to zero with HPA alone. For batch workloads or consumers that are idle overnight, you're paying for standby replicas that do nothing.
What Changed in Kubernetes 1.27–1.30?
Two HPA features reached stable in recent releases that solve the sidecar and oscillation problems without adding KEDA. They're underused — probably because they graduated quietly without much ceremony (Kubernetes autoscaling docs, 2026). Both address the failure modes above without reaching for KEDA.
ContainerResource Metrics — Stable in 1.30
This feature was introduced in Kubernetes 1.20, moved to beta in 1.27 with HPAContainerMetrics enabled by default, and graduated to stable (GA) in 1.30. It lets HPA target the resource usage of a specific named container — not the blended pod average.
apiVersion: autoscaling/v2
kind: HorizontalPodAutoscaler
metadata:
  name: app-container-hpa
spec:
  scaleTargetRef:
    apiVersion: apps/v1
    kind: Deployment
    name: my-app
  minReplicas: 2
  maxReplicas: 10
  metrics:
  - type: ContainerResource
    containerResource:
      container: app        # targets this container only — ignores sidecars
      name: cpu
      target:
        type: Utilization
        averageUtilization: 60
If the named container isn't present in a pod, that pod is excluded from the utilization calculation. This makes ContainerResource strictly more accurate than Resource for any pod with multiple containers. If you're running service mesh sidecars, switch to this.
Configurable Scaling Behavior — Stable Since 1.23
The behavior field in autoscaling/v2 gives you independent control over scale-up and scale-down, including rate limits and stabilization windows. The defaults are opinionated: scale-down waits 300 seconds before acting; scale-up is immediate and aggressive (4 pods or 100% of replicas per 15 seconds, whichever is larger).
Those defaults cause real problems on noisy workloads. Metrics fluctuate, replicas thrash, bursty traffic double-scales. Most production setups need something in between:
apiVersion: autoscaling/v2
kind: HorizontalPodAutoscaler
metadata:
  name: api-hpa
spec:
  scaleTargetRef:
    apiVersion: apps/v1
    kind: Deployment
    name: api
  minReplicas: 3
  maxReplicas: 50
  metrics:
  - type: Resource
    resource:
      name: cpu
      target:
        type: Utilization
        averageUtilization: 65
  behavior:
    scaleUp:
      stabilizationWindowSeconds: 0     # react immediately to spikes
      policies:
      - type: Percent
        value: 100
        periodSeconds: 15               # at most double replicas per 15s
    scaleDown:
      stabilizationWindowSeconds: 120   # wait 2 minutes before scaling down
      policies:
      - type: Percent
        value: 10
        periodSeconds: 60               # remove at most 10% of replicas per minute
The conservative scaleDown policy is intentional. Removing 10% per minute means a 20-replica deployment takes 10 minutes to fully scale down. That's fine. What you avoid is rapid scale-down followed by immediate scale-up when your P99 spikes again.
If you're designing for resilience alongside autoscaling, the distributed computing architecture patterns post covers failure isolation and graceful degradation strategies.
What Is KEDA and How Does It Actually Work?
KEDA (Kubernetes Event-Driven Autoscaler) is a CNCF-graduated project that fills the two gaps HPA can't: scale-to-zero and event-driven metric sources. It doesn't replace HPA. It manages one for you (KEDA concepts, 2026).
KEDA plays two distinct roles in the cluster:
- Agent — handles 0→1 and 1→0 replica transitions. When events appear, KEDA activates the deployment. When the queue empties, KEDA deactivates it. This is the
keda-operatorcontainer. - Metrics adapter — registers as an external metrics server and exposes event source data (queue depth, stream lag, Prometheus query results) to the HPA it creates. The HPA then handles 1→N scaling using those metrics. This is
keda-operator-metrics-apiserver.
When you create a ScaledObject, KEDA installs four custom resources:
scaledobjects.keda.sh— maps an event source to a Deployment or StatefulSetscaledjobs.keda.sh— maps an event source to a Kubernetes Job (for batch processing)triggerauthentications.keda.sh— namespace-scoped credentials for event sourcesclustertriggerauthentications.keda.sh— cluster-scoped equivalent
Install via Helm:
helm repo add kedacore https://kedacore.github.io/charts
helm repo update
helm install keda kedacore/keda \
  --namespace keda \
  --create-namespace
Verify all three components are running:
kubectl get pods -n keda
# keda-operator-...                        1/1  Running
# keda-operator-metrics-apiserver-...      1/1  Running
# keda-webhooks-...                        1/1  Running
The admission webhook (keda-webhooks) is the third component. It blocks you from creating multiple ScaledObjects targeting the same workload, which would create conflicting HPAs and unpredictable scaling behavior.
KEDA 2.x ships with 72 built-in scalers. The major ones: Apache Kafka (Microsoft-maintained), AWS SQS, RabbitMQ, Prometheus, Redis, Cron, GCP Pub/Sub, Azure Service Bus, and Predictkube (AI-based predictive scaling, v2.6+). The full list is at keda.sh/docs/scalers.
What Do Real KEDA ScaledObject Patterns Look Like?
Four patterns cover most of what you'll encounter in production.
Kafka Consumer — Scale on Consumer Lag
This is the most common use case. Don't scale on CPU — scale on how far behind the consumer group is. When lag is zero, the deployment should be at zero replicas.
apiVersion: keda.sh/v1alpha1
kind: ScaledObject
metadata:
  name: order-processor
  namespace: payments
spec:
  scaleTargetRef:
    name: order-consumer
  minReplicaCount: 0          # idle at zero when no lag
  maxReplicaCount: 30
  pollingInterval: 15         # check lag every 15s
  cooldownPeriod: 60          # wait 60s before scaling to zero after last event
  triggers:
  - type: kafka
    metadata:
      bootstrapServers: kafka-broker:9092
      consumerGroup: order-processors
      topic: orders
      lagThreshold: "10"      # one replica per 10 messages of lag
      offsetResetPolicy: latest
With minReplicaCount: 0, the consumer sits dormant outside business hours. When orders arrive, KEDA activates it (0→1), then the managed HPA scales it out (1→N) as lag builds. When the queue drains, cooldownPeriod prevents immediate scale-down — useful if your producer is bursty.
AWS SQS with Pod Identity — No Credentials in Secrets
Most examples you'll find for SQS use a Kubernetes Secret with AWS credentials. Don't do that. Use IRSA (IAM Roles for Service Accounts) or EKS Pod Identity:
apiVersion: v1
kind: ServiceAccount
metadata:
  name: sqs-worker-sa
  namespace: workers
  annotations:
    eks.amazonaws.com/role-arn: arn:aws:iam::123456789012:role/sqs-keda-role
---
apiVersion: keda.sh/v1alpha1
kind: TriggerAuthentication
metadata:
  name: sqs-pod-identity
  namespace: workers
spec:
  podIdentity:
    provider: aws              # uses IRSA automatically
---
apiVersion: keda.sh/v1alpha1
kind: ScaledObject
metadata:
  name: sqs-worker
  namespace: workers
spec:
  scaleTargetRef:
    name: sqs-consumer
  minReplicaCount: 0
  maxReplicaCount: 20
  triggers:
  - type: aws-sqs-queue
    authenticationRef:
      name: sqs-pod-identity
    metadata:
      queueURL: https://sqs.us-east-1.amazonaws.com/123456789012/job-queue
      region: us-east-1
      queueLength: "5"         # target: 5 messages per active replica
queueLength: "5" means KEDA aims to keep approximately 5 messages per running replica. With 50 messages in the queue, expect 10 replicas. TriggerAuthentication with podIdentity supports AWS, Azure Workload Identity, GCP Workload Identity, EKS Pod Identity, and Hashicorp Vault — no long-lived static credentials needed for any of them.
Prometheus Scaler — Scale on Request Rate
For HTTP services where CPU isn't a reliable proxy, scale on actual request rate pulled directly from Prometheus:
apiVersion: keda.sh/v1alpha1
kind: ScaledObject
metadata:
  name: api-rps-scaler
spec:
  scaleTargetRef:
    name: api-deployment
  minReplicaCount: 2
  maxReplicaCount: 40
  triggers:
  - type: prometheus
    metadata:
      serverAddress: http://prometheus.monitoring:9090
      metricName: http_requests_total
      query: sum(rate(http_requests_total{job="api"}[2m]))
      threshold: "500"         # one replica per 500 req/s
The query field accepts any PromQL. You can scope by label, filter by status code, subtract internal health checks — whatever makes sense for your workload. This is reactive to actual demand rather than a downstream effect of demand.
Cron Scaler — Scheduled Workloads
For batch jobs and business-hours workloads, the Cron scaler removes the need for any external trigger at all:
apiVersion: keda.sh/v1alpha1
kind: ScaledObject
metadata:
  name: batch-job-scaler
spec:
  scaleTargetRef:
    name: report-generator
  triggers:
  - type: cron
    metadata:
      timezone: Europe/London
      start: "0 8 * * 1-5"    # Mon-Fri at 08:00
      end: "0 18 * * 1-5"     # Mon-Fri at 18:00
      desiredReplicas: "10"
You can combine Cron with another trigger in the same ScaledObject. KEDA picks the highest replica count from all active triggers — so if a Cron trigger wants 10 replicas and a Kafka lag trigger wants 15, you get 15.
For a broader perspective on how containerised infrastructure has evolved to support these patterns, see Cloud Computing Over 10 Years: A 2015-2025 Review.
HPA vs KEDA — When to Use Which
Running both is the normal outcome on mature clusters. HPA handles user-facing HTTP services where CPU tracks load reasonably well. KEDA handles the queue consumers and batch jobs that should idle at zero overnight.
| Scenario | Tool |
|---|---|
| HTTP service, CPU tracks load well | HPA (Resource) |
| Pod has sidecars you want to exclude | HPA (ContainerResource) — K8s 1.30+ |
| Kafka / SQS / RabbitMQ consumer | KEDA |
| Scale to zero during off-hours | KEDA |
| Scale on Prometheus metric (RPS, latency) | KEDA |
| Scheduled / batch workloads | KEDA (Cron scaler) |
| HTTP service + async consumer in same cluster | Both — HPA for HTTP, KEDA for consumer |
| HTTP + queue triggers on same Deployment | KEDA (multiple triggers, picks highest) |
| Stateful workload, horizontal scaling risky | VPA or in-place resize (K8s alpha) |
One thing to be explicit about: when you deploy a KEDA ScaledObject, KEDA creates an HPA on your behalf. If you also create a manual HPA targeting the same Deployment, you'll get a conflict. The KEDA admission webhook blocks this, but only when it's running. Check:
kubectl get validatingwebhookconfigurations | grep keda
Common Pitfalls and How to Debug
Most autoscaling failures in production trace back to four issues.
Cold start from zero. Scaling from minReplicaCount: 0 means KEDA schedules a pod, pulls the image, and waits for the app to start. That gap — often 30-90 seconds depending on image size and init containers — is invisible in local testing and painfully visible in production during the first real burst. Set minReplicaCount: 1 for anything with a user-facing SLA. Scale-to-zero is for background workers and overnight batch jobs where cold start doesn't matter.
Polling interval versus cooldown mismatch. pollingInterval controls how often KEDA checks the trigger (default 30s). cooldownPeriod controls how long it waits before scaling to zero after events stop (default 300s). Too high a polling interval means you react slowly to bursts. Too low a cooldown means you oscillate: scale to zero, immediately back to one when the next batch arrives, repeat. The oscillation pattern is easy to miss until you look at replica count graphs over a 24-hour window.
Missing resources.requests. This one is a silent failure. HPA — including the HPA KEDA creates — cannot compute utilization-based metrics if containers don't declare resource requests. It simply won't scale on those metrics and produces no error. Check every container in every pod you're autoscaling. kubectl describe hpa will show <unknown> in the current metrics column when requests are missing.
Noisy metrics and scale-down thrashing. Without stabilizationWindowSeconds in behavior.scaleDown, HPA scales down as soon as metrics dip below target — then immediately back up when they spike again. Sixty seconds of stabilization avoids most of this. The conservative 300-second default exists for a reason on high-traffic services; the aggressive default is fine for development environments where you want fast feedback.
Debug flow:
# Check HPA status and what it's currently measuring
kubectl get hpa -A
kubectl describe hpa web-api-hpa

# Check ScaledObject state and last trigger evaluation
kubectl get scaledobject -A
kubectl describe scaledobject order-processor

# Check admission webhook is healthy
kubectl get validatingwebhookconfigurations | grep keda

# See recent scale events
kubectl get events --field-selector reason=SuccessfulRescale -n payments
The describe scaledobject output includes the current metric value, target, and last decision. It's the fastest way to tell whether KEDA is reading the trigger correctly.
Where Is Kubernetes Autoscaling Heading?
Before closing, two things worth watching in the next 12 months.
Predictkube (KEDA v2.6+) is an AI-based predictive scaler built on Prometheus metrics and the Dysnix SaaS backend. Instead of reacting to current queue depth, it predicts future demand and pre-scales. It requires their external service, so there's a dependency to evaluate — but the approach is sound for workloads with cyclical patterns where reactive scaling always lags by a control loop interval or two.
InPlacePodVerticalScaling (alpha since K8s 1.27) changes the equation for stateful services. Currently, if you need more CPU for a StatefulSet member, you restart the pod. In-place resize lets you change container resource limits without a restart. Once this reaches GA, the calculus for single-instance or leader-election workloads shifts significantly — VPA becomes a real option where it previously wasn't.
For now, the practical stack: HPA with ContainerResource metrics for HTTP services, KEDA for async consumers and scheduled jobs, and behavior tuning on both to avoid oscillation.
Frequently Asked Questions
Can KEDA and HPA be used together on the same workload?
KEDA creates and manages an HPA internally when you deploy a ScaledObject. Don't also manually create an HPA targeting the same Deployment — KEDA's admission webhook will block it. For separate workloads in the same cluster (e.g., HTTP service on HPA, queue consumer on KEDA), there's no conflict.
Does KEDA replace HPA?
No. For 1→N scaling, KEDA delegates to the HPA it creates and registers itself as the external metrics server for that HPA. The main things KEDA adds are: scale-to-zero (0↔1 transitions), 72+ event source scalers, and workload identity-based authentication for external trigger sources.
What is the minimum Kubernetes version required for ContainerResource metrics?
The ContainerResource metric type was introduced in Kubernetes 1.20, moved to beta in 1.27 (enabled by default via the HPAContainerMetrics feature gate), and reached stable/GA in Kubernetes 1.30. If you're on 1.27 or later, it's on by default — you just need to use the autoscaling/v2 API and set type: ContainerResource in the metrics block.
How do I stop KEDA from scaling a latency-sensitive workload to zero?
Set minReplicaCount: 1 in the ScaledObject spec. KEDA will still manage scaling from 1→N based on the event trigger, but won't deactivate the deployment to zero. The default minReplicaCount is 0, so you need to set this explicitly for any service where cold-start latency is a concern.