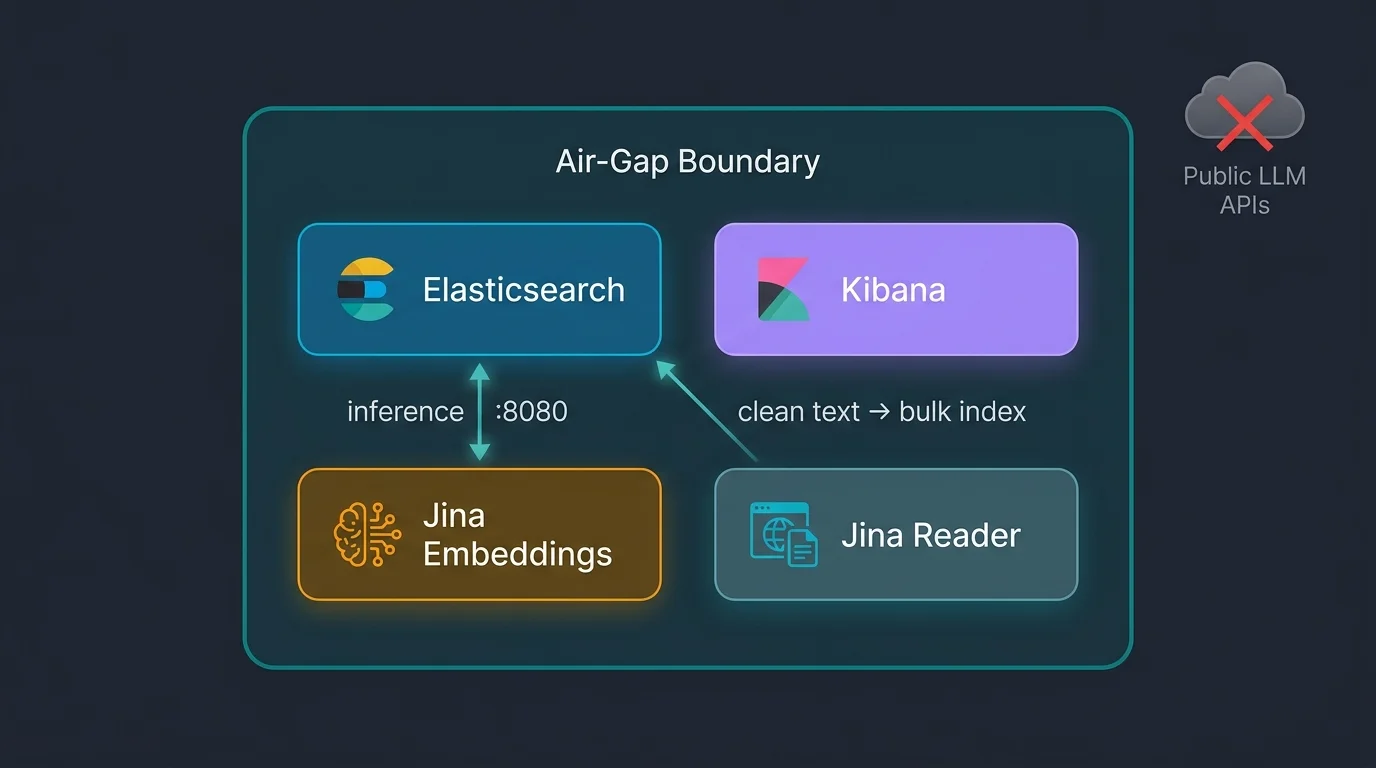
• Home
  • About
  • Projects
  • Skills
  • Experience
  • Certifications
  • Blog
  • Contact
© 2026 Ade A. All rights reserved.
Home/Blog

Blog

Insights on cloud architecture, distributed systems, AI, and modern software engineering practices.

Elasticsearch storage optimization diagram showing data tiers, ILM lifecycle phases, and storage reduction percentages

Elasticsearch Storage Optimization: ILM, Mapping, pattern_text

Cut Elasticsearch storage by up to 95% using mapping discipline, ILM tiering, LogsDB, and pattern_text — a practical guide for platform engineers.

March 21, 202622 min read
ElasticsearchPlatform Engineering
Elasticsearch 9.x key updates: elastic wordmark with HNSW vector graph, server stack, and stat cards showing 95% memory reduction, 12x indexing throughput, sub-20ms search, and ES|QL GA

What's New with Elasticsearch: Key Updates

Elasticsearch 9.1–9.3 cut vector memory 95%, landed DiskBBQ sub-20ms search, made ES|QL production-ready, and acquired Jina AI. Here's what changed operationally.

March 19, 202613 min read
ElasticsearchAI/MLObservability
Engineer viewing Elastic Observability dashboard with distributed tracing timeline, JVM memory chart, and log stream on a dark monitor with Elastic logo visible

Observability with EDOT — Streams, Gateways, and Scale

EDOT went GA in April 2025. Three-tier Kubernetes collectors, Elastic Streams, OpAMP remote config, and automated SLO breach workflows for platform teams.

March 5, 202617 min read
ElasticsearchObservabilityPlatform Engineering
Elasticsearch at scale: four workload panels for Search, Observability, Security, and Vector AI with stat badges showing 500B docs, 95% memory savings, 1895 detection rules, and sub-20ms vectors

Elasticsearch at Scale: Search, Logs, Security, and Vector AI

Elasticsearch at scale — from 500B-document clusters to 95% vector memory reduction with BBQ — covering Search, Observability, Security, and AI/ML with a hosting model comparison.

March 3, 202619 min read
ElasticsearchObservabilityAI/ML
Hand-drawn architecture sketch of the full Elastic Stack: Filebeat, Metricbeat, Heartbeat, APM Agent, and Fleet-managed Elastic Agent feeding through Logstash and ingest pipelines into an Elasticsearch cluster, with Kibana monitoring panel showing cluster health, JVM heap, thread pools, and 9 alert rules

Elasticsearch Stack Monitoring, A Production Guide

Cluster health is green until it isn't. Stack Monitoring surfaces JVM pressure, thread pool rejections, disk headroom, and CCR lag — nine default alert rules before incidents.

February 24, 202613 min read
ElasticsearchObservabilityPlatform Engineering
Hand-drawn whiteboard diagram comparing HPA and KEDA: left side shows kube-controller-manager with CPU gauge at 70%, pod scaling, ContainerResource annotations, and Fluentd sidecar; right side shows keda-operator with Kafka, SQS, PromQL, and Cron event sources, ScaledObject, and scale-to-zero pods managing HPA internally

Kubernetes Autoscaling: HPA vs KEDA — A Platform Engineer's Guide

Kubernetes autoscaling with HPA covers CPU-bound services well. KEDA extends it with 72+ scalers and scale-to-zero. Here's when to use each in production.

February 20, 202615 min read
KubernetesPlatform Engineering