Observability with EDOT — Streams, Gateways, and Scale
Observability with EDOT — Streams, Gateways, and Scale
EDOT — Elastic's Distribution of OpenTelemetry — went generally available with Elasticsearch 9.0 in April 2025. That single milestone changed the conversation for platform teams. It's no longer a question of whether to standardize on OpenTelemetry. The question is how to operate it at production scale without the instrumentation sprawl, config drift, and pipeline fragility that made OTel a pain to run for years.
The pieces that make this work in production are not obvious from the docs alone. This covers the three-tier Kubernetes collector model, Elastic Streams, OpAMP Central Configuration, and the Agent Builder + Workflows automation pattern — with enough operational detail to implement them.
What you'll take away from this post:
- EDOT went GA with Elasticsearch 9.0 in April 2025, covering Java, .NET, Node.js, Python, PHP, iOS, and Android SDKs plus the EDOT Collector (EDOT overview)
- Self-managed deployments require a Gateway Collector running the
elasticapmconnector; Elastic Cloud uses the managed mOTLP endpoint — no gateway to provision- Elastic Streams (Elasticsearch 9.2+) enables per-stream retention, AI-powered log parsing, and automatic Significant Events detection without ILM policy sprawl
- OpAMP Central Configuration lets you change sampling rates and log levels cluster-wide in ~10 seconds, without a deployment rollout
- Elastic Workflows + Agent Builder (GA in 9.3) can automate SLO breach triage — query logs, reason over them, create a case — triggered directly from a Kibana alert rule
What EDOT Captures — Signal Coverage at a Glance
Before the architecture, here's exactly what you're getting. This table replaces the usual bullet list of "features" — useful because the signal type determines which collector tier is responsible.
| Signal | Source | EDOT Component | Since |
|---|---|---|---|
| Application traces | Java, .NET, Node.js, Python, PHP, iOS, Android | EDOT SDK → Collector / mOTLP | 9.0 GA |
| Infrastructure metrics | Host CPU, memory, disk, network | EDOT Daemon Collector (hostmetrics receiver) | 9.0 GA |
| Kubernetes metrics | Pod states, HPA events, cluster resources | EDOT Cluster Collector (k8s_cluster receiver) | 9.0 GA |
| Container logs | Node-local log files | EDOT Daemon Collector (filelog receiver) | 9.0 GA |
| APM pre-aggregated metrics | Service latency, error rate, throughput | Gateway Collector (elasticapm connector) | 9.2 |
| Kubernetes resource attributes | Pod name, namespace, container, node | k8sattributes processor (Daemon Collector) | 9.0 GA |
| SDK remote configuration | Sampling rate, log level, feature flags | OpAMP protocol → Kibana Agent Config UI | 9.1+ Tech Preview |
| GenAI / LLM traces | AWS Bedrock, model invocation spans | EDOT Python SDK | 9.1 |
The last row matters if you're running ML pipelines. EDOT Python gained basic GenAI tracing in late 2025 — you get span-level visibility into LLM calls without writing custom instrumentation.
For any team running LLM pipelines, that used to mean writing custom spans by hand for every model provider. Now it's a dependency inclusion and a configuration line.
What's new in 9.x: The
elasticapmprocessor andelasticapmconnector that generate APM pre-aggregated metrics became GA in Elastic 9.2. These are required for self-managed deployments — without them, APM UI performance degrades significantly at high trace volumes. (EDOT Collector deployment modes)
The Architecture: Edge, Gateway, and Backend
Three collector tiers map to three different data proximity problems. Edge collectors sit on the node where data is generated. The Gateway collector is the centralized processing layer. The backend is Elasticsearch. They're not interchangeable — each tier exists because the layer below it can't do its job.
Edge collectors — close to the data
Edge collectors run on or near the application. In Kubernetes, that means a DaemonSet on every node. They perform two jobs: collect local telemetry (logs, host metrics, application traces from SDKs on the same node) and enrich it with resource metadata before it leaves the node.
The k8sattributes processor is what makes this enrichment happen. It watches the Kubernetes API and appends pod name, namespace, container image, node name, and deployment name to every span, metric, and log that passes through. Without this, correlating a trace to its originating pod is manual work.
EDOT uses any OTLP-compatible source at the edge — including the upstream contrib collector and custom-built distributions. You don't need EDOT specifically at the edge. The requirement is simply that data arrives as valid OTLP. Teams with existing OTel pipelines can keep their edge collectors and gain the Elastic backend benefits immediately. (EDOT reference architecture)
Gateway collectors — centralized processing and scale
The Gateway collector is a centralized Deployment (not a DaemonSet) that receives OTLP data from all edge collectors before forwarding to Elasticsearch. Its key properties:
- Horizontally scalable — add replicas under load
- Single OTLP endpoint — reduces connection count to Elasticsearch dramatically
- Required for self-managed Elastic — it runs the
elasticapmprocessor and connector that APM functionality depends on - Handles batching and buffering — absorbs burst traffic before it hits your cluster
For Elastic Cloud Serverless and Cloud Hosted, you skip the self-managed Gateway entirely. The Managed OTLP Endpoint (mOTLP) is a fully managed ingestion layer backed by Kafka, built into the platform. Edge collectors send OTLP directly to it. No gateway to provision, no Kafka cluster to manage.
Deployment path by environment type
| Deployment type | Gateway required? | Recommended path |
|---|---|---|
| Self-managed / ECK / ECE | Yes | EDOT Gateway Collector |
| Elastic Cloud Hosted | No | Managed OTLP Endpoint |
| Elastic Cloud Serverless | No | Managed OTLP Endpoint |
| Simple app-only tracing (Cloud) | No | EDOT SDK → mOTLP direct |
For teams that only need application traces and are on Elastic Cloud, no collector is required. EDOT SDKs send directly to the mOTLP endpoint. The collector earns its place when you need local filtering, metadata enrichment, or log and metric collection from the host itself.
EDOT in Kubernetes — The Three-Tier Pattern
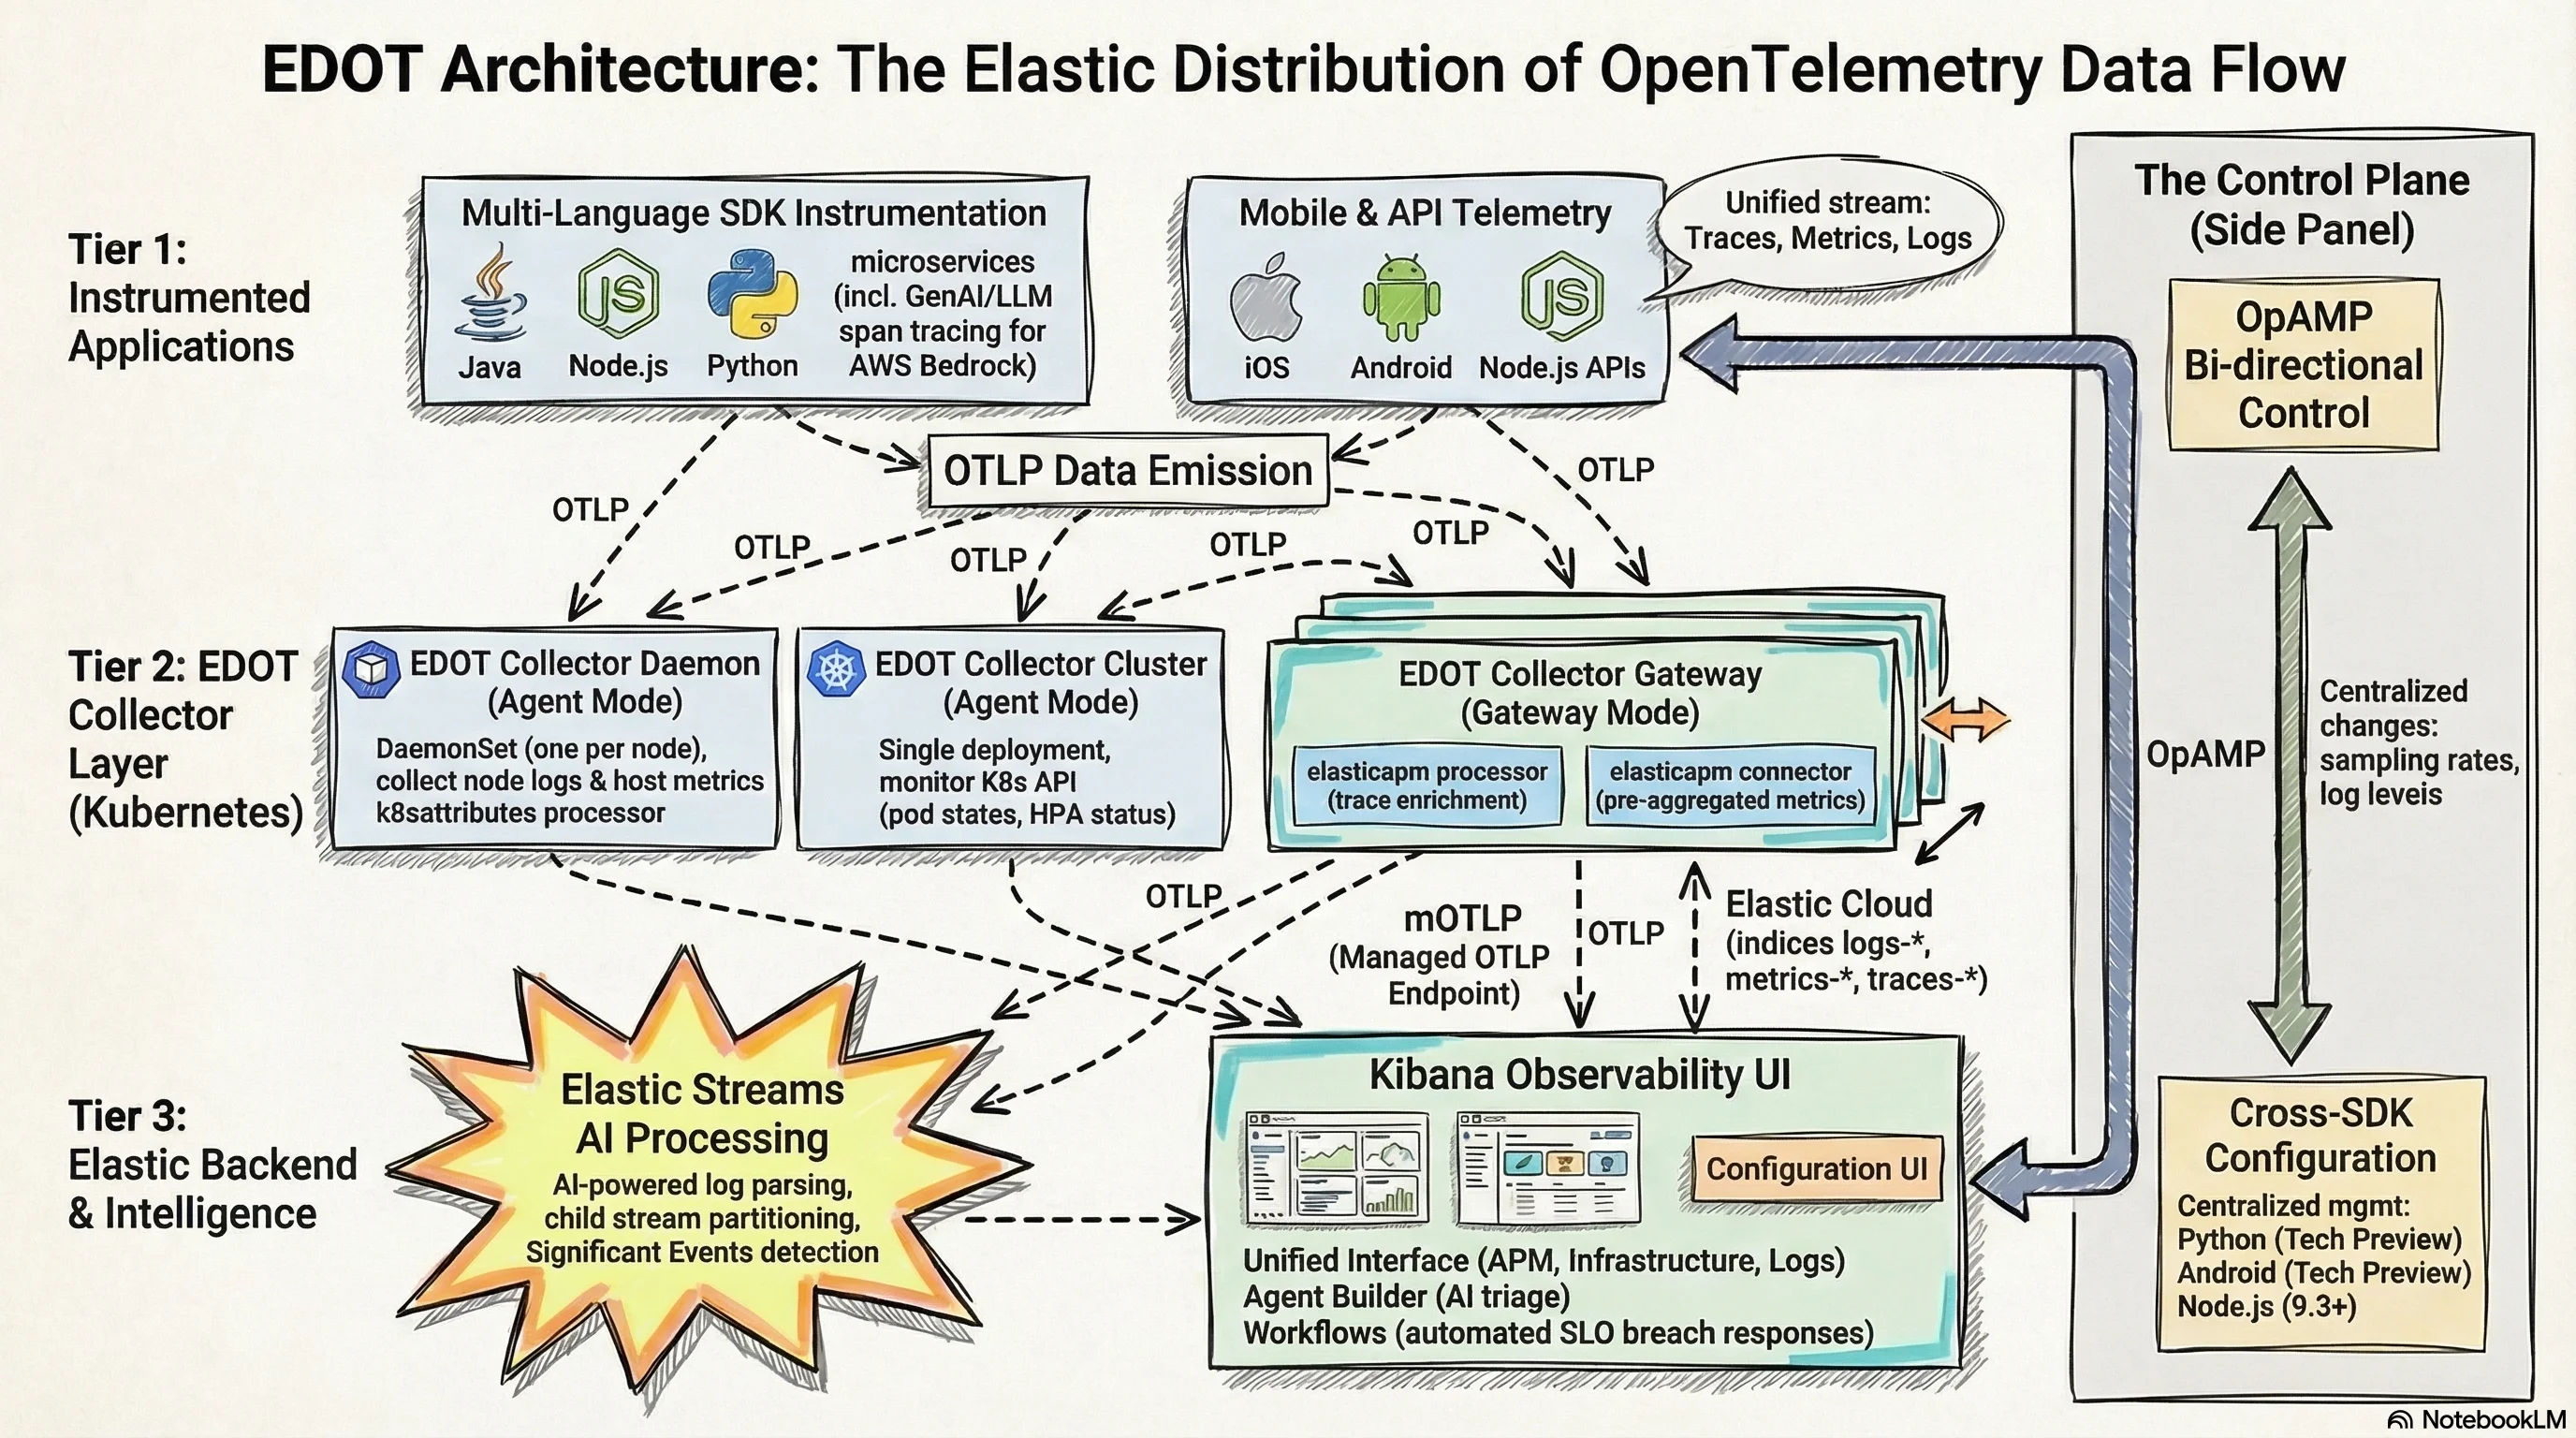
In Kubernetes, the canonical EDOT deployment uses three collector types that work together:
EDOT Collector Daemon (DaemonSet): One instance per node. Collects node-local logs via the filelog receiver, host metrics via hostmetrics, and receives application telemetry from EDOT SDKs running on pods on the same node. Enriches all data with Kubernetes attributes before forwarding to the Gateway via OTLP.
EDOT Collector Cluster (Deployment): A single instance that watches the Kubernetes API server. Collects cluster-wide metrics — pod phases, deployment status, HPA scaling events, persistent volume claims. Data that the Daemon can't see because it's not tied to a specific node.
EDOT Collector Gateway (Deployment): Receives everything from Daemon and Cluster collectors. Runs elasticapm processor enrichment on traces, elasticapm connector for APM metric generation, and handles routing of signals to the correct Elasticsearch indices: traces-*, metrics-*, logs-*. This is the scaling boundary.
The recommended install path is the kube-stack Helm chart, which deploys all three collector types and the OpenTelemetry Operator in one shot. The Operator enables auto-instrumentation — annotate a namespace and EDOT SDKs are injected automatically without touching application Dockerfiles.
# Auto-instrumentation annotation for a namespace
# All new pods get EDOT Java SDK injected automatically
apiVersion: v1
kind: Namespace
metadata:
  name: payments
  annotations:
    instrumentation.opentelemetry.io/inject-java: "true"
For Node.js services in the same namespace:
metadata:
  annotations:
    instrumentation.opentelemetry.io/inject-nodejs: "true"
The SDK version is managed centrally through the Instrumentation custom resource — one place to bump SDK versions across every annotated service. That matters on teams with dozens of microservices. Updating the agent in 40 Dockerfiles individually is exactly the kind of toil that gets deferred until something breaks.
Elastic Streams — Intelligence After the Data Lands
EDOT handles collection and transport. After data lands in Elasticsearch, the operational burden traditionally shifted to index lifecycle management and ingest pipeline configuration — a separate set of primitives you had to learn and maintain. Elastic Streams, GA in Elasticsearch 9.2 and Serverless, shifts retention and routing configuration out of index templates and into a stream-level UI.
Streams is an AI-assisted log management layer built on top of data streams. Its core capabilities:
Automatic log parsing: Streams analyzes your incoming log records and extracts structured fields via AI-powered parsing or a point-and-click interface. You can simulate parsing changes against real data before applying them — a meaningful safety net when you're dealing with high-volume production logs.
Stream partitioning: Route log data into child streams based on field values — by service, environment, or any attribute EDOT adds to your records. A rule like "all logs where kubernetes.namespace = payments go to logs.payments" is expressed directly in the UI and takes effect without touching index templates.
Significant Events: Streams surfaces anomalous log patterns automatically — error rate spikes, new error message signatures, sudden drops in log volume. These aren't pre-configured alerts; they're detected from the data itself. The output feeds directly into the Observability overview.
Failure Store and Data Quality: Streams monitors ingestion health. Documents that fail parsing land in a failure store rather than being silently dropped. You see the failure count, the reason, and can fix the parsing rule without losing historical data. (Elastic Streams docs)
The most practical scale benefit of Streams is partition-level retention. Instead of managing ILM policies at the index template level — which applies a single retention schedule to all logs — Streams lets you set different retention periods per child stream. Debug logs from a development namespace can expire in 3 days; payment service audit logs can retain for 90. Previously this required separate data streams with separate ILM policies for each logical group.
# Enable Streams for the logs signal type (Elasticsearch 9.2+)
PUT /_streams/logs/_enable

# Partition by kubernetes namespace
POST /_streams/logs/_partitioning
{
  "field": "kubernetes.namespace",
  "partitions": ["payments", "auth", "notifications"]
}
Central Configuration via OpAMP — One Change, Everywhere
Managing SDK configuration across hundreds of services has never had a clean solution. Without a remote control plane, a sampling rate change means touching environment variables or config files across dozens of deployments — and waiting for rollouts while your incident is still live.
EDOT's answer is OpAMP — the Open Agent Management Protocol. It lets the Kibana Agent Configuration UI push configuration changes directly to running EDOT SDK instances without a redeploy.
Current status as of early 2026:
- EDOT Python: Tech Preview since 9.1
- EDOT Node.js: Supported from 9.3+ (Kibana Agent Configuration UI)
- EDOT Android: Tech Preview since 9.1
What's configurable remotely: sampling rate, log level, enabled instrumentation modules, trace context propagation settings. The change propagates to all SDK instances connected to that Kibana within seconds.
Why this matters at scale: A p99 latency spike in production often triggers the instinct to increase trace sampling to see more data. With OpAMP, that change takes 10 seconds from the Kibana UI and applies cluster-wide. Without it, you're waiting for a deployment rollout — or accepting incomplete trace coverage while the incident is live.
Agent Builder, Workflows, and Dynamic SLO Response
Before OpAMP, changing a sampling rate meant touching environment variables across every deployment and waiting for rollouts — the exact moment you least want to wait during an active incident. That's the problem OpAMP is solving. The complementary question is: what happens when something breaches an SLO threshold? That's where Agent Builder and Workflows come in.
SLOs in Elastic Observability let you define error budgets against any signal EDOT collects — APM latency percentiles, availability windows, or custom KQL queries over indexed telemetry. What makes them useful in practice is the automation layer around them.
Elastic Agent Builder (GA in 9.3) is the AI reasoning layer. The built-in Observability agent can query logs, correlate traces, and surface anomalies from natural language. Elastic Workflows is the deterministic automation layer — event-driven YAML pipelines that can trigger actions without external tools.
Combined, they enable a pattern where an SLO breach initiates an investigation and response workflow without a human in the loop for the initial triage.
Here's a concrete workflow that fires when an SLO error budget drops below 20% and uses Agent Builder to reason over the contributing logs:
version: "1"
name: slo_breach_investigation
description: Triggers on SLO error budget alert, uses AI agent to triage root cause
enabled: true
triggers:
  - type: kibana.alert
    rule_type: slo.rules.burnRate

steps:
  # Step 1: Get recent error logs for the affected service
  - name: get_error_logs
    type: elasticsearch.search
    with:
      index: "logs-*"
      query:
        bool:
          filter:
            - term:
                service.name: "{{ alert.context.service }}"
            - term:
                log.level: "ERROR"
            - range:
                "@timestamp":
                  gte: "now-15m"
      size: 20

  # Step 2: Ask the Observability agent to analyze the logs
  - name: analyze_errors
    type: ai.agent
    with:
      agent_id: "observability-agent"
      message: |
        The SLO for service {{ alert.context.service }} has breached its burn rate.
        Review these recent error logs and identify the most likely root cause:
        {{ steps.get_error_logs.output }}
        Suggest the top 3 remediation actions.

  # Step 3: Create a case in Kibana with the AI analysis
  - name: create_case
    type: kibana.request
    with:
      method: POST
      path: /api/cases
      body:
        title: "SLO Breach: {{ alert.context.service }} — {{ alert.context.burnRateThreshold }}x burn rate"
        description: "{{ steps.analyze_errors.output }}"
        tags: ["slo-breach", "auto-triaged", "{{ alert.context.service }}"]
The ai.agent step is a native Workflow step type — no external API calls, no custom integrations. The agent receives the Elasticsearch query results as context and reasons over them. The output becomes the case description. (Agent Builder + Workflows docs)
For teams using KEDA for Kubernetes autoscaling, this pattern extends naturally: Workflows can trigger a KEDA-managed scale-out on the affected service as a remediation step, alongside the case creation, without manual intervention.
Three Scenarios: EDOT From Signal to Resolution
The following scenarios trace a real class of production incident through the full EDOT stack — from initial signal detection to case creation. Each one would look different without distributed telemetry.
Scenario 1 — Memory leak in a Java microservice
The order-service JVM heap metric starts climbing at a steady rate across a 6-hour window. EDOT Java SDK is emitting jvm.memory.used, and by the time it crosses 85% of max heap, process.runtime.jvm.gc.duration spikes are appearing on the Daemon Collector. The SLO on order-service availability fires a burn rate alert from Kibana's APM Service Map — p99 latency is up.
The Workflow triggers, queries the last 30 minutes of traces filtered by error.type, and passes the results to the Observability agent. EDOT Java's auto-instrumentation has full stack traces on each failing request. The case that lands in the on-call engineer's queue contains: "Memory growth pattern consistent with connection pool not being released in OrderRepository.findByCustomerId. Connection pool exhaustion causing GC pressure."
Rolling restart buys time; the fix targets the repository. Time from alert to identified root cause: under 8 minutes, no SSH into pods required.
Scenario 2 — Log flood causing disk watermark breach
Where Scenario 1 was a slow degradation, this one is an acute volume problem — and it shows where Elastic Streams pays for itself.
Signal: A misconfigured logging library in a Node.js service starts emitting 500 log lines per request — a debug flag shipped to production. EDOT Daemon Collector's filelog receiver picks it up. Elasticsearch disk usage crosses the high watermark threshold.
Detection: Elasticsearch Stack Monitoring alerts on the disk watermark. Elastic Streams' Data Quality panel shows an ingest failure rate spike on logs.node-api — the volume exceeds index buffer limits.
Investigation: Streams' Significant Events surfaces the pattern: a new log message signature [DEBUG] query_params: appearing in 40,000 records per minute, up from near zero. The service name and pod are in the EDOT-enriched kubernetes.labels.app field.
Resolution path: Streams processing rule added: drop records where log.level = DEBUG from the node-api namespace. Takes effect immediately, no index template change, no collector restart. Disk pressure resolves within minutes. The underlying debug flag gets reverted in the next deployment.
Result: Disk watermark breach resolved in under 5 minutes. In a pre-Streams setup, this would require an index template update and potentially a coordinator restart.
Scenario 3 — Cascading timeout across service boundaries
This is the scenario that most clearly demonstrates why distributed tracing is not optional. Without span-level service correlation, you're debugging by elimination.
Signal: EDOT SDKs in all three services — api-gateway, auth-service, user-profile — are generating traces. The distributed trace view shows spans from api-gateway timing out waiting on auth-service, which is itself waiting on a slow user-profile database query.
Detection: This is invisible without distributed tracing. Individual service error rates look marginal. APM's Service Map makes the dependency chain visible — user-profile's database query p95 has climbed from 12ms to 1.4s.
Investigation: EDOT Python SDK (on user-profile) captures the slow query span with db.statement populated. The full SQL is in the trace. Correlating with infrastructure metrics from the EDOT Cluster Collector shows the PostgreSQL pod's memory usage at 94% — a connection pool exhaustion on the database side causing query queuing.
Resolution path: The database pod gets resource limits adjusted. The distributed trace makes clear the cascade: api-gateway was the visible failure, but the cause was three hops deep in a database connection pool. Without distributed tracing, the obvious first suspect — api-gateway config or upstream network — would have burned hours before the real cause surfaced. For teams managing this kind of service mesh at scale, see Getting Data into Elasticsearch for the ingestion patterns that keep trace data queryable under load.
Where EDOT Goes Next
OpAMP Central Configuration is rolling out across more SDK languages. Python and Node.js are already in preview; the expectation is broad coverage across the GA SDK set by mid-2026. That milestone turns EDOT from a collection infrastructure into a managed fleet — you control instrumentation behavior across your entire service graph from one UI.
The Elastic Cloud Forwarder is the upcoming path for cloud-native ingestion from AWS and Azure without running collector infrastructure. Combined with the mOTLP endpoint, it removes the last reason to run a custom OTel pipeline for cloud-native workloads.
Streams is available in Elasticsearch 9.2+ and Serverless. If you're on a version prior to 9.2, it's the most concrete reason to plan a cluster upgrade — the log management UX shift is substantial.
For teams evaluating EDOT against managing the upstream OTel contrib collector directly: the decision point is Central Configuration and enterprise support SLAs. The wire protocol is identical. The operational advantage is the management plane.
Frequently Asked Questions
Do I need a Gateway collector if I'm on Elastic Cloud?
No. Both Elastic Cloud Hosted and Cloud Serverless provide the Managed OTLP Endpoint (mOTLP) — a Kafka-backed ingestion layer built into the platform. EDOT SDKs and edge collectors send directly to it. Self-managed deployments (ECK, ECE, on-premises) require the Gateway Collector to run the elasticapm processor and connector that APM functionality depends on. (EDOT deployment modes)
Which EDOT SDKs support OpAMP Central Configuration?
As of early 2026: EDOT Python (Tech Preview since Elastic 9.1), EDOT Node.js (Kibana Agent Configuration UI from 9.3+), and EDOT Android (Tech Preview since 9.1). Java, .NET, PHP, and iOS do not yet support OpAMP remote configuration — those still require environment variable or config file changes and a redeployment.
What Elasticsearch version is required for Elastic Streams?
Elastic Streams requires Elasticsearch 9.2+ or Elastic Cloud Serverless. It is not available on earlier 8.x or 9.0/9.1 versions. If you're running a self-managed cluster below 9.2, Streams is the most concrete reason to plan an upgrade — the per-stream retention and AI-powered parsing features are not backportable.
Can I keep my existing OTel collector setup and still use EDOT?
Yes. EDOT at the edge only requires valid OTLP output. Teams with existing upstream OTel contrib collectors or custom distributions can keep their edge infrastructure and route OTLP to an EDOT Gateway or directly to the mOTLP endpoint. The Elastic backend benefits — APM pre-aggregated metrics, Streams, Kibana Observability UI — are independent of which collector generated the OTLP data.
For AI search capabilities built on the same Elasticsearch backend, see Elasticsearch as an AI Platform.